
Functional & Productivity Tools
Intuitive utilities designed to assemble publication-ready figures, baseline tables, and statistical plots with zero code required.
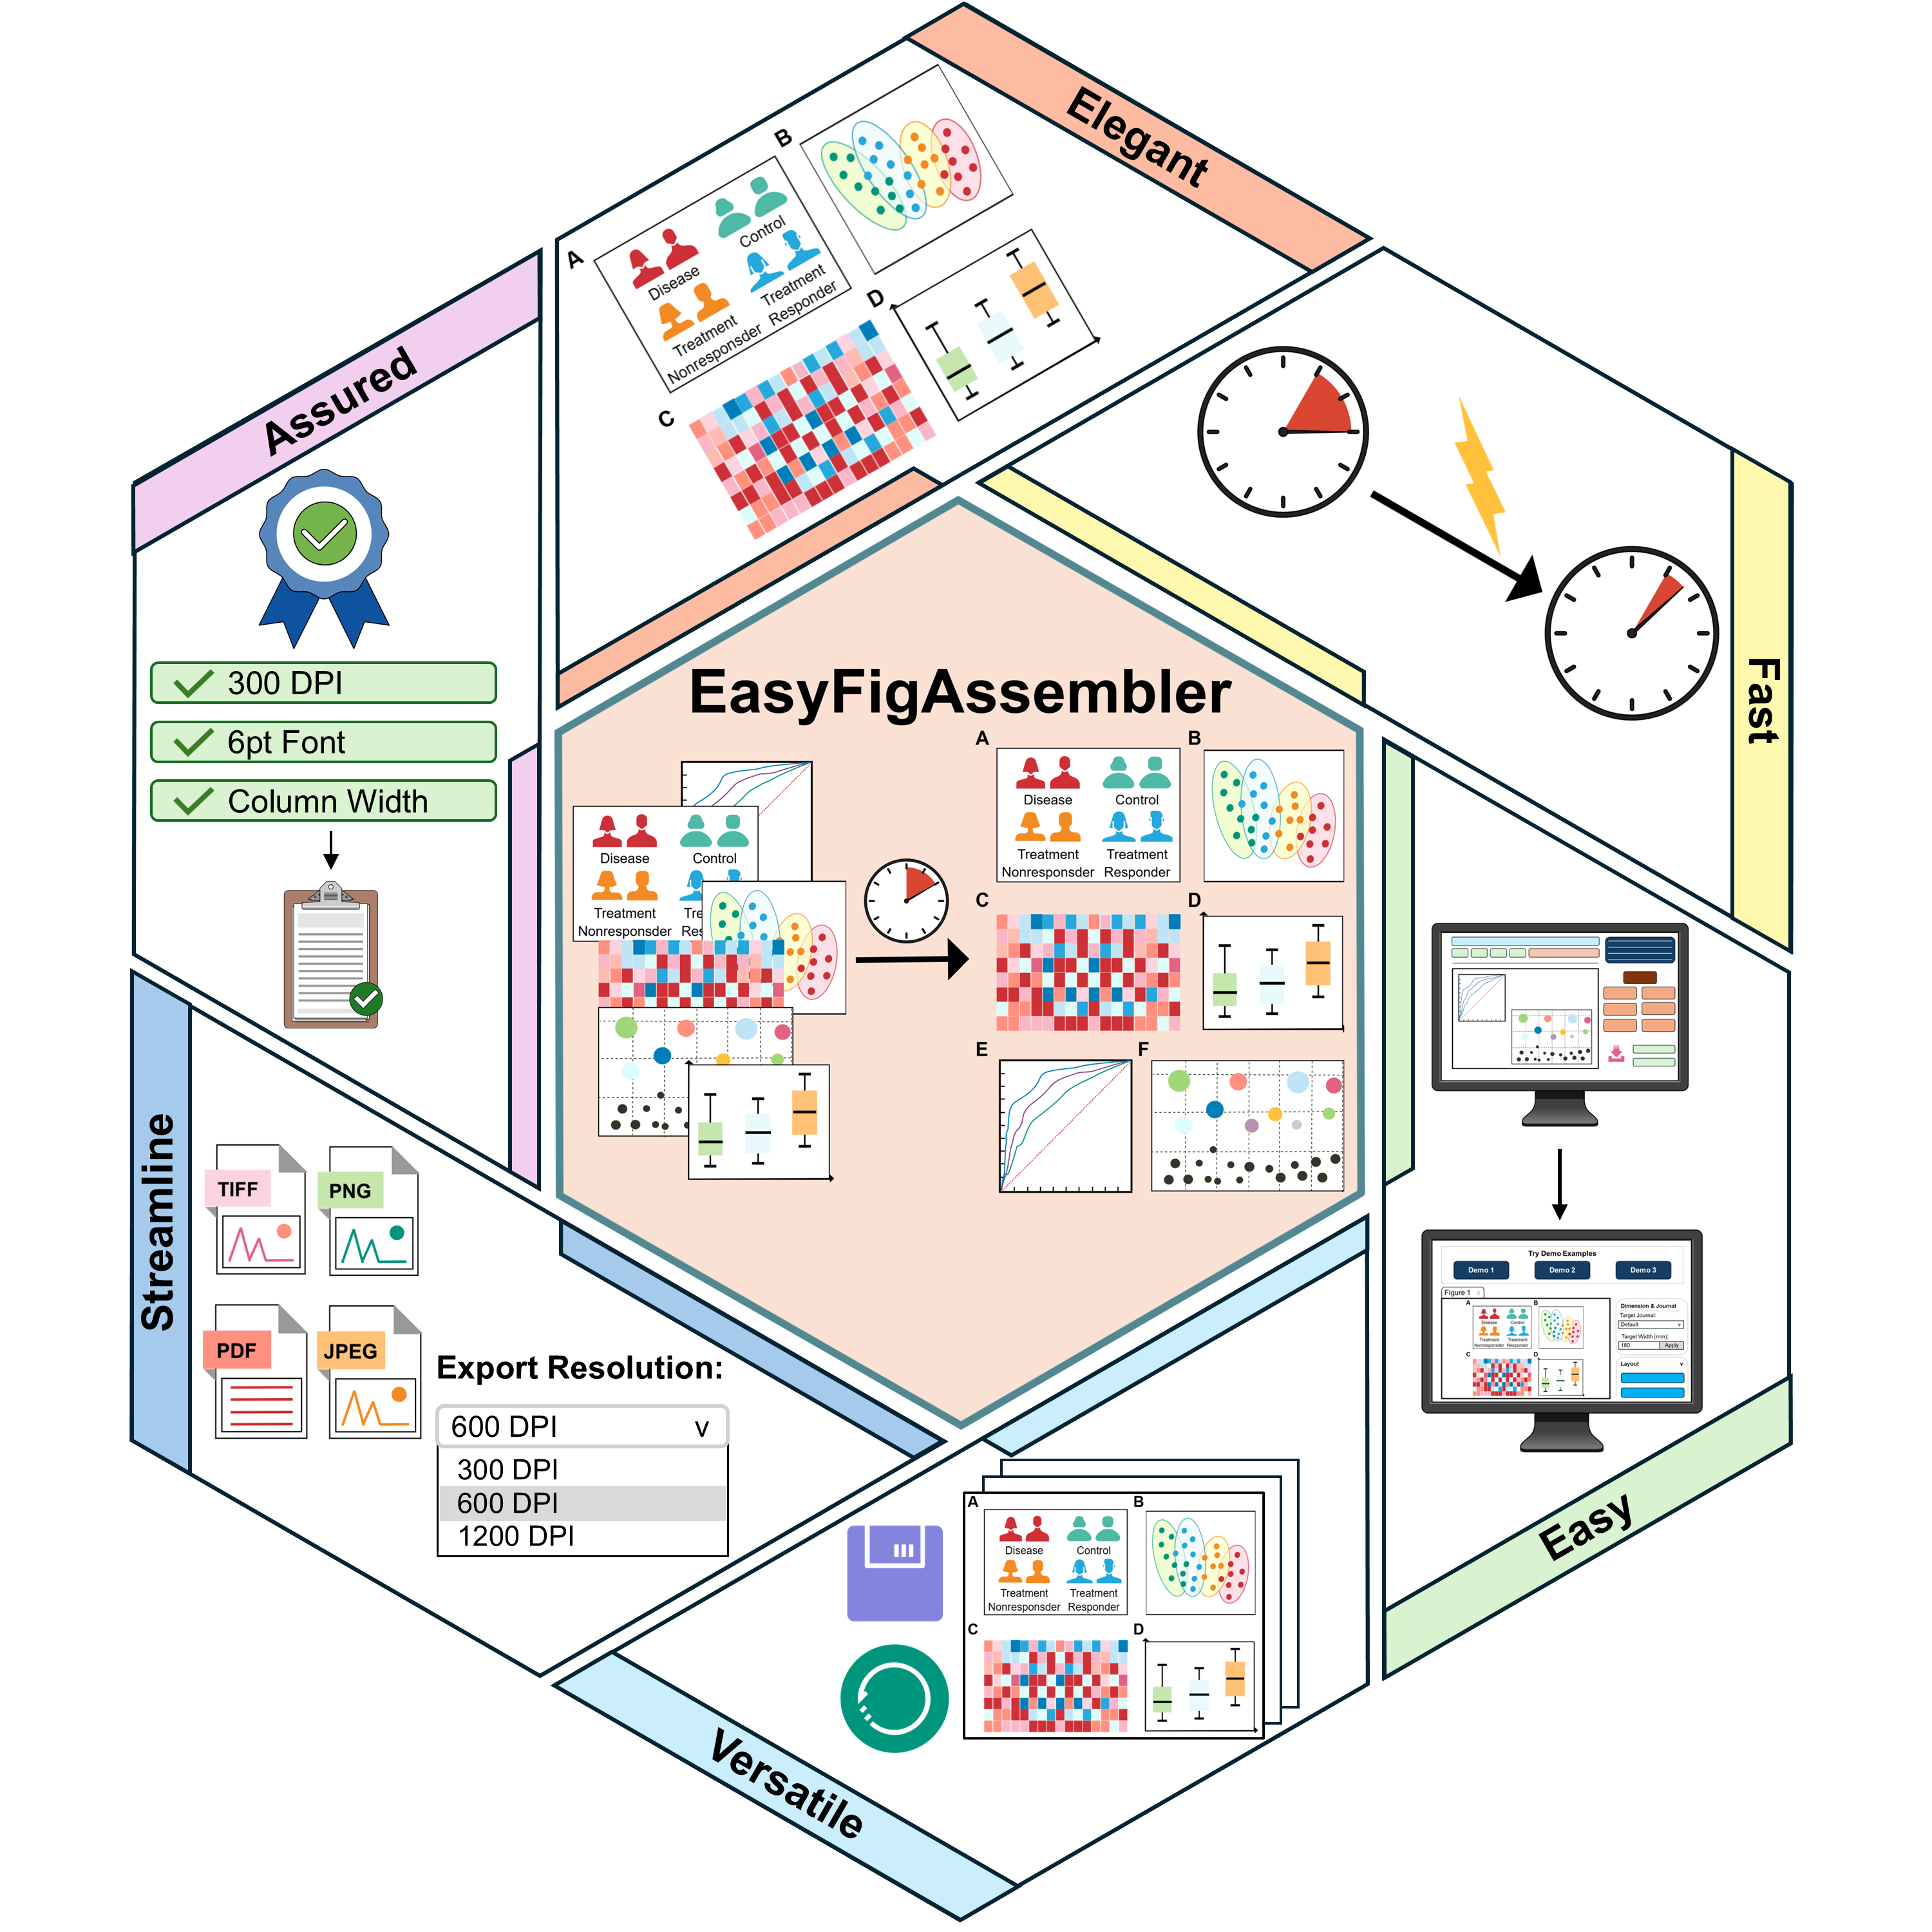
EasyFigAssembler
Assemble complex, multi-panel figures for scientific manuscripts with precision. Arrange, label, scale, and align panels to meet strict journal formatting standards seamlessly.
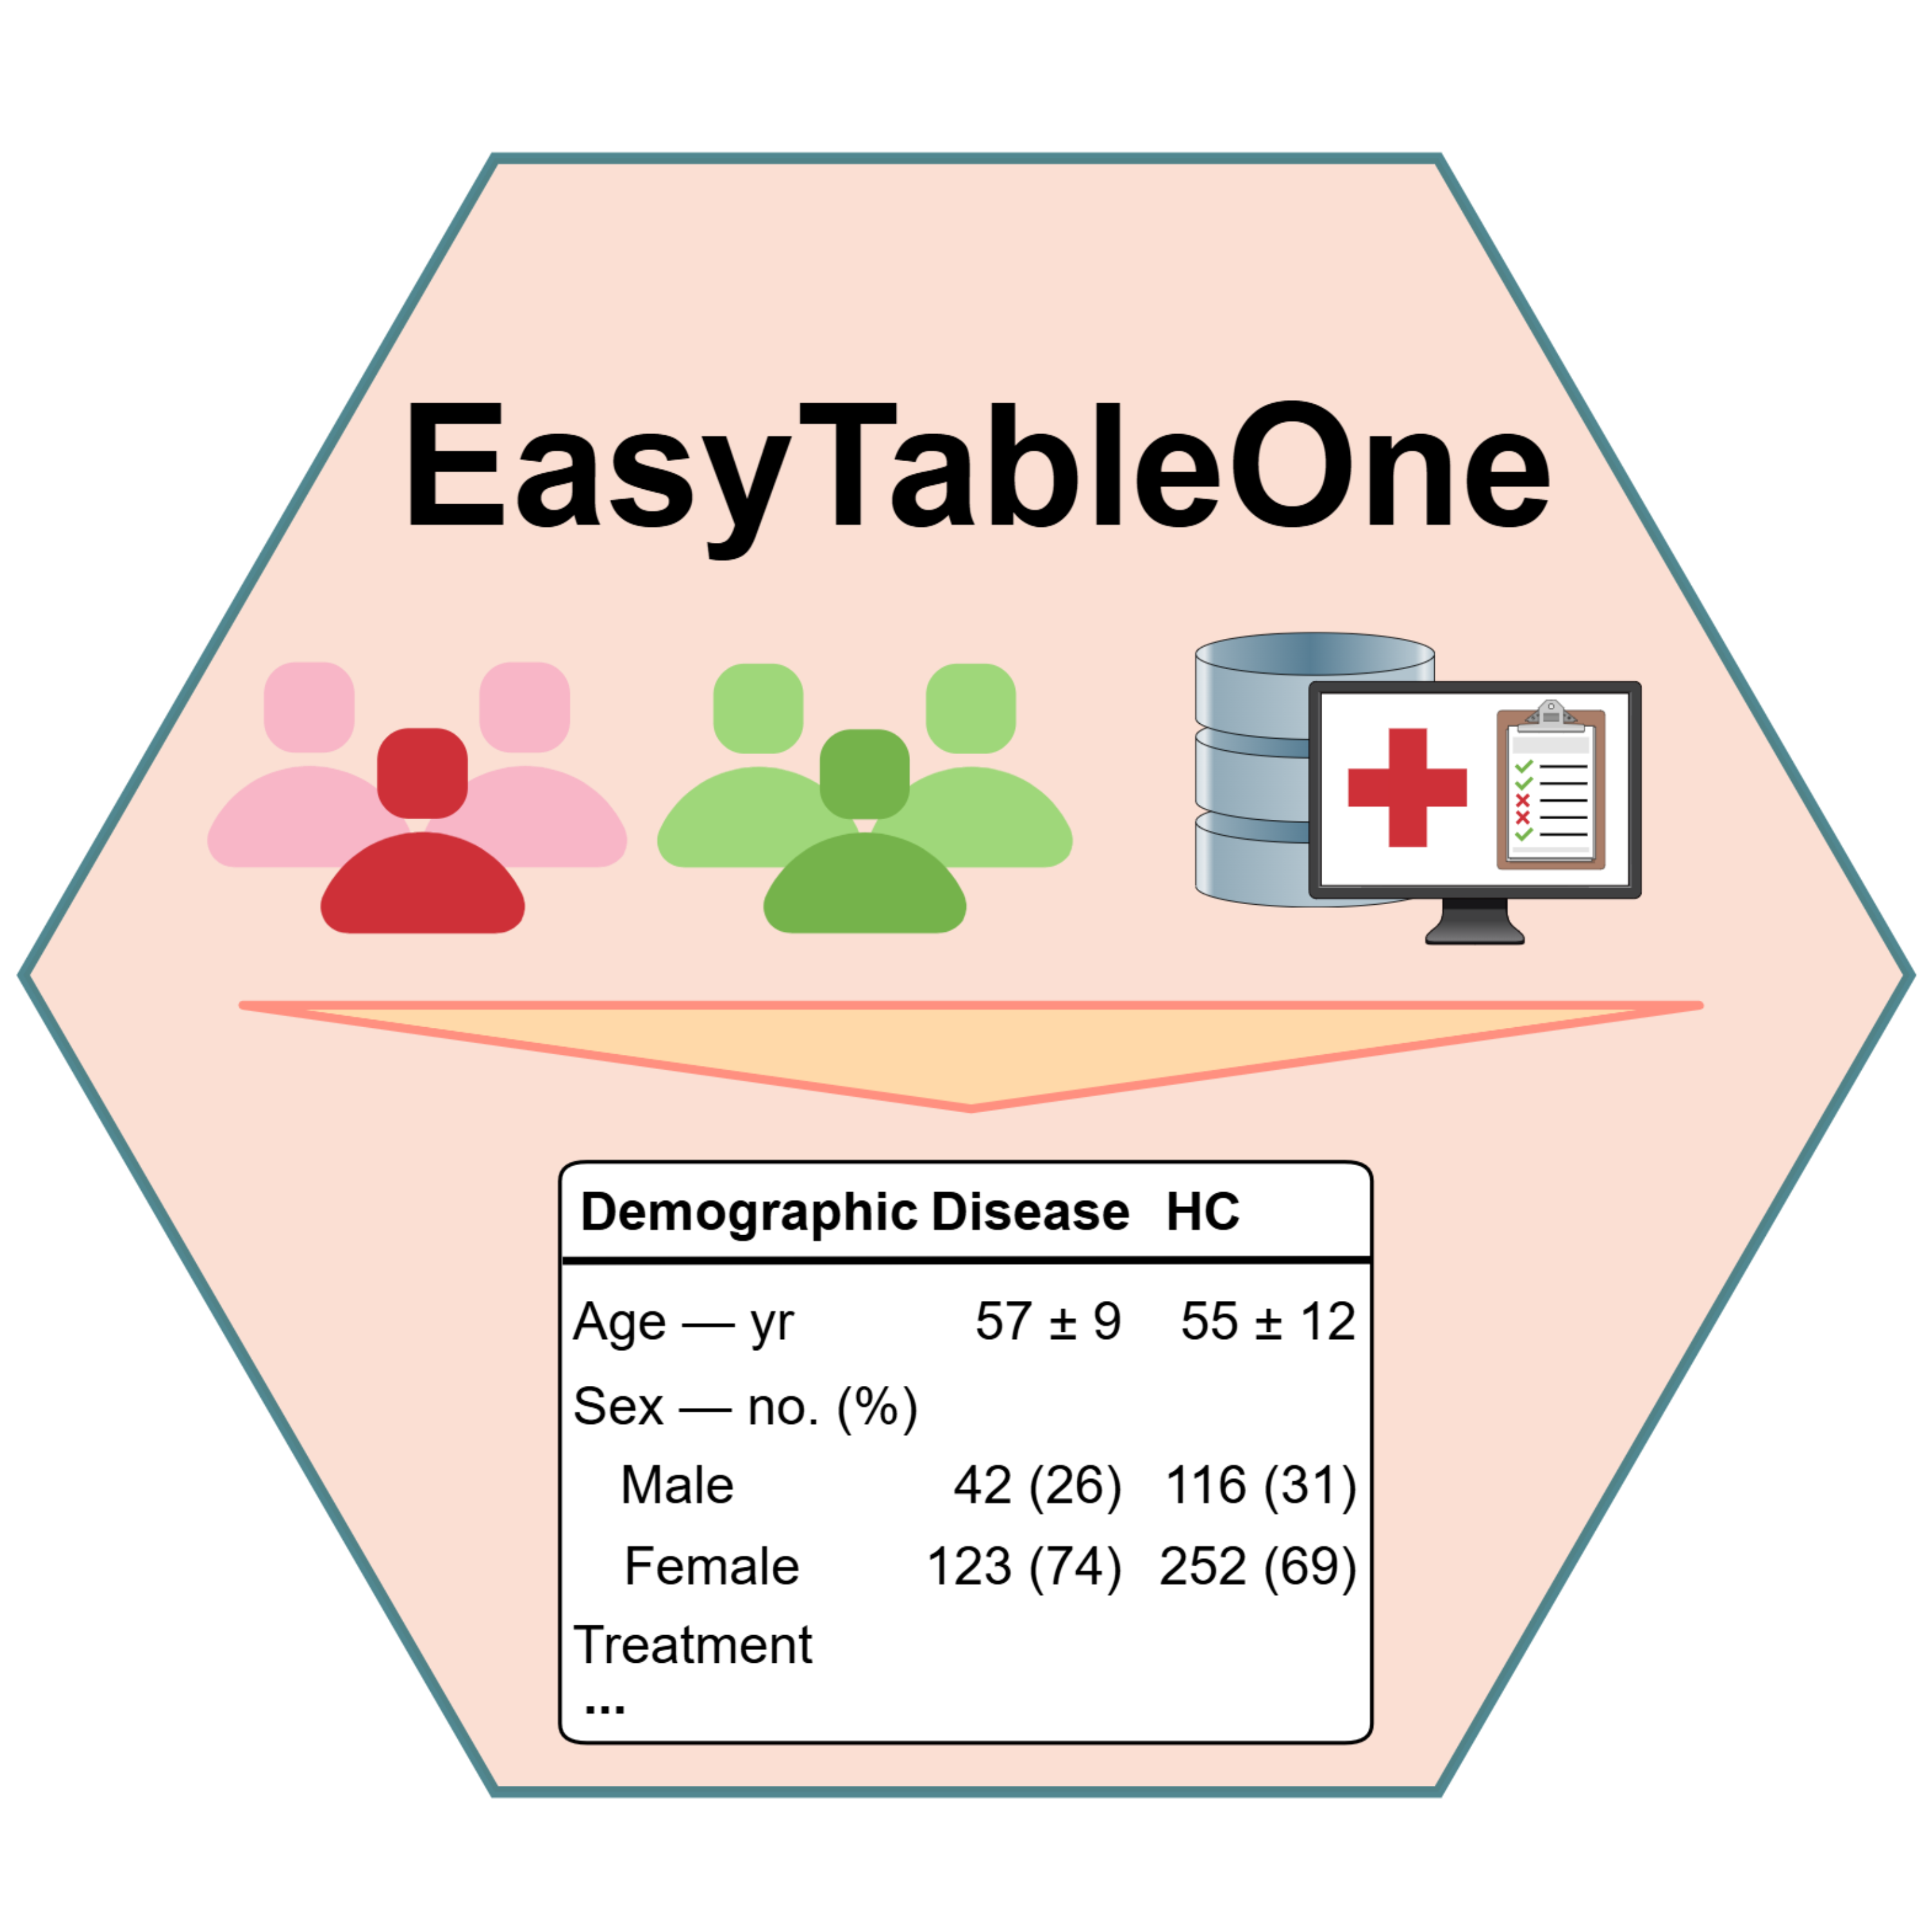
EasyTableOne
Effortlessly generate Table 1 (baseline characteristics) for clinical and observational research. Automatically calculate summary statistics, p-values, and export publication-ready tables.
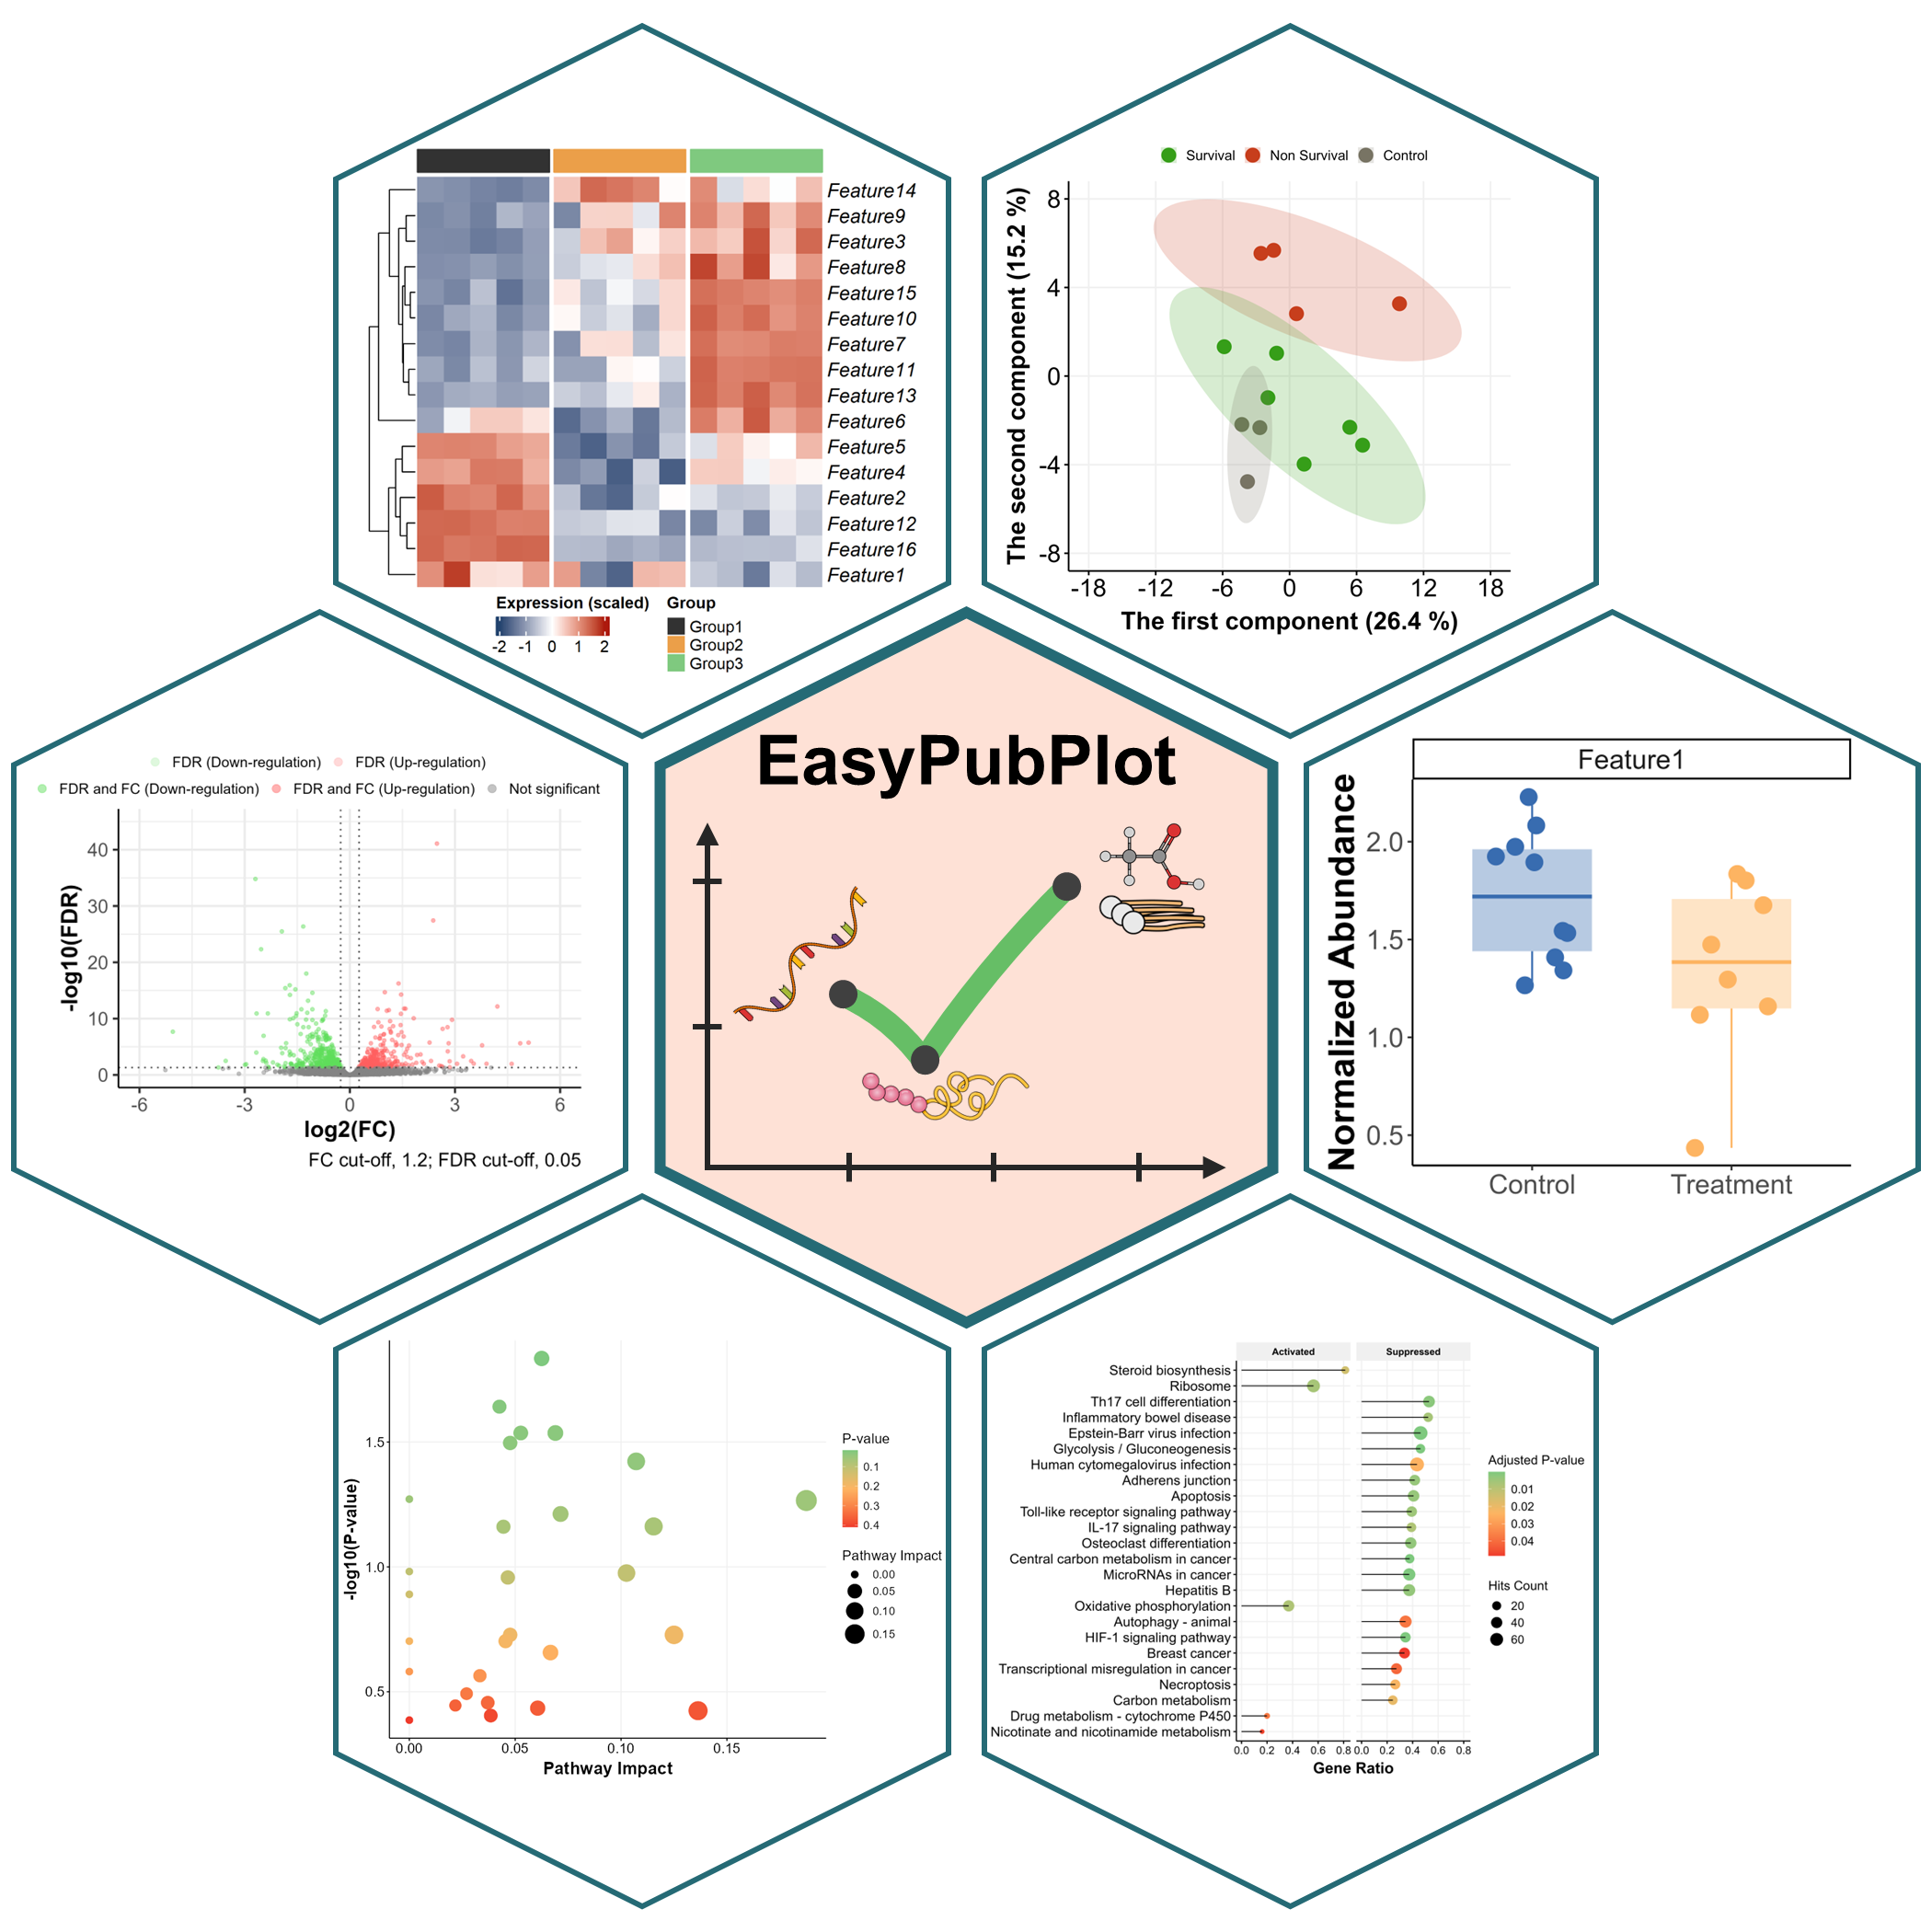
EasyPubPlot
Generate publication-grade scientific plots and graphs with fine-grained customization. Upload raw datasets, configure aesthetics, and export in vector SVG/PDF formats.
EasyRModeling
Perform high-performance statistical modeling and predictive analytics powered by R workflows. Execute regression modeling, survival analysis, and cohort stratification for biomedical datasets.
Data Mining Platforms
Accompanied Research Publications & Interactive ExplorersInteractive exploratory data platforms accompanying our lab's published studies, enabling open exploration and figure reproduction.
EasyOmiFun
Explore and mine multi-omics datasets with automated clinical metadata matching. Perform differential expression analysis, feature selection, and biological pathway exploration.
NeoSepPulmoExplorer
Explore longitudinal multi-omics signatures and host immune responses in neonatal sepsis cohorts. Mine biomarker dynamics, clinical trajectories, and outcome associations.
EasyLipidVis
Dissect and visualize complex lipidomics data with interactive volcano plots, lipid class distributions, and chain-length heatmaps. Identify lipid alterations and metabolic pathways.